Maximum drawdown
Expressed as a percentage and as an absolute KSh figure against your notional balance. This single number tells you more about survivability than win rate does.

Backtesting
Run your rule set against up to five years of historical tick data and get a structured report — before you risk any live capital.
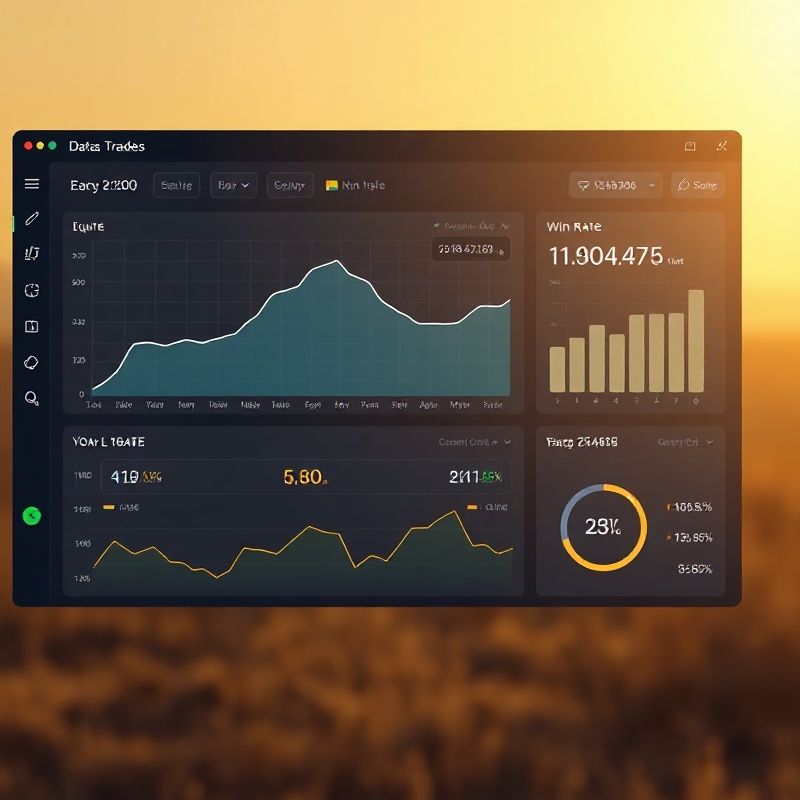
A pretty equity curve is easy to produce if you overfit parameters to past data. Learningpathz backtesting is designed to surface the uncomfortable truths as clearly as the encouraging ones. Each test run returns: total trades, win rate, average win vs. average loss, maximum consecutive losing streak, maximum drawdown (both in percentage and absolute KSh value if you set a notional balance), and a Sharpe-ratio approximation. All figures are computed on tick-level data, not daily OHLC bars — which means the spread and slippage you'd face in live trading are already baked into the result. Reports are exportable as CSV so you can do your own analysis.
Backtesting tells you how a strategy would have performed under past conditions — it cannot guarantee future results. Liquidity gaps, news events, and structural market changes can produce outcomes a backtest never captured. Learningpathz does not hide this: every backtest report includes a plain-language caveat section and a forward-test recommendation. We also flag strategies that show suspiciously high win rates (above 80%) — a common sign of curve-fitting — and prompt you to run a walk-forward validation before going live. Our job is to give you an honest tool, not to sell you a story.
Five data points that matter more than the equity curve alone.
Expressed as a percentage and as an absolute KSh figure against your notional balance. This single number tells you more about survivability than win rate does.
Average amount gained or lost per trade, weighted by probability. A positive expectancy with a realistic trade frequency is the baseline you need before going live.
Every trade in the test period — entry price, exit price, duration, and result — exported so you can cross-check in your own spreadsheet or feed into a third-party analytics tool.
“The backtest showed my strategy had a maximum drawdown of 34% over the 2022 period — I had no idea it was that severe. I adjusted my lot sizing, re-ran the test, and got that figure down to 18% before I went anywhere near a live account. That one number saved me a significant amount.”
Brian Mutuku, Nairobi
Upload your rule set and run your first backtest free — results in under two minutes.
View pricing and get started